Hey,
Thanks for the patience. I’ll see if I can help clear some things up:
BALENA_HOST_CONFIG_gpu_mem
So this setting is deciding how much of the Pi memory is being dedicated to the GPU. The value you set this to depends on a few things: how much memory the device has, and what work the device is intended to do. So for instance, if you had a Pi3 which has 1Gb of memory you would be more conservative than if you had a Pi4 8Gb model. Work-wise, this setting only helps if your device is using the GPU for hardware accelerated video rendering, either with a video player, a game or the browser with H/W accelerated rendering enabled. For a balenaDash device rendering video I would recommend you set this value to 128Mb but no higher.
balenaDash browser
This project is about to undergo a version bump which will see all supported devices run the Chromium browser (release date TBC) but the current version runs two different browsers depending on the device type you use. It maps like this:
| Device Type |
browser |
| Raspberry Pi 3 |
WPE |
| Raspberry Pi3 (64bit OS) ^ |
Chromium |
| Raspberry Pi 4 |
Chromium |
^ you can create a Raspberry Pi 4 application but add a Raspberry Pi 3 running the 64bit OS to it - which will then run Chromium
This is important to understand, since it constrains what we can now do to try and debug why your webpage is crashing after playing a video. Your screenshot in the original post is showing the cog error page from the WPE browser - and AFAIK we cannot remotely debug this.
However, we can try if you either create a “Raspberry Pi 3 (using 64bit OS)” application in balenaCloud and reflash your device, or try a Raspberry Pi 4 in a new (RPi4 device type) application. It’s important that you create a new application and flash a device for it, to ensure the device is running a 64bit OS and therefore gets the Chromium version of the kiosk service.
To check, make sure you aren’t running in kiosk mode (no KIOSK environment variable set to 1) and the page should load with the familiar Chrome/Chromium menu and status bars.
** Remote Debugging **
Once you’re sure your device is running Chromium, we can focus on the remote debugging. As per Anton’s post above, you need to set an environment variable called FLAGS to --remote-debugging-address=0.0.0.0 --headless --remote-debugging-port=9222 --disable-dev-shm-usage --no-sandbox . What this does is tell Chromium that any IP using port 9222 can remotely debug the loaded page. We disable shared memory as part of the browser running in a container. We run the browser headless to allow remote debugging.
Then on your laptop/desktop machine you need to open a Chrome browser and navigate to chrome://inspect make sure “Discover network targets” is checked and click the “Configure” button:

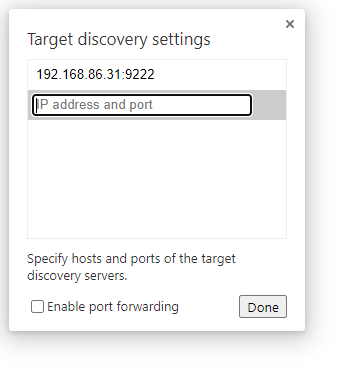
Then enter the IP address of the Raspberry Pi (found on your balenaCloud dashboard):

with the remote debugging port into the “Target Discovery Settings” dialogue:

Now click done, and the device should appear in the list of remote targets:

You can now inspect the page, and see if you can debug the crash.
Hope this helps,
Phil


