I’ve just got around to watching the ‘Happy Hour #38’ video which describes using Balena blocks to quickly setup a data collection and visualisation application. Kudos to the Balena team - really cool video. I made a similar application using http data collection from a sensor and it all worked really well. Balena blocks are great idea and big help!
One query I have regarding these type of applications - when using InfluxDB I presume the default data retention policy will be used in the docker image which is to keep data forever? I would have thought it would be desirable on an IoT type device to only retain InfluxDB data for a set period (to avoid your storage eventually filling up), presumably you could login to the InfluxDB container and issue an influxdb command such as:
to just keep a years worth of data. However I wonder if it’s possible to set a retention policy for the InfluxDB image rather than having to set this for each individual device?
I’ve looked around a bit at the documentation and my feeling is that you can’t but maybe somebody knows otherwise.
Hi there, I’m glad you like the balena blocks, the whole purpose of those is to make things easy for people and not have to figure things out on their own. Because of this we wanted to limit the configuration you can do and set some sane defaults, but there are definitely cases where you do want some control over the configuration, such as the case you mentioned. Let me open an issue about this, and we can probably expose that setting as an envvar. Here’s the issue, feel free to PR if you are up for it: Allow configuring the retention policy through a variable · Issue #16 · balenablocks/dashboard · GitHub
Hi - thanks for the reply. Yes my initial thoughts would be for this to be done via an envvar, however I have a feeling it can’t be due to the retention policy being set at the time of database creation. Hopefully I’m wrong
Phil, I meant to say that in the happy hour video you were absolutely right about being able to use Balena blocks to quickly build up a prototype system.
I did just this for my mangers when they wanted a sensor data collection and display solution that could be easily deployed to different locations. It was great to be able to show them not only a working prototype but to also have the functionality of things like WiFi connect and a proper kiosk mode. This would have taken me ages to setup.
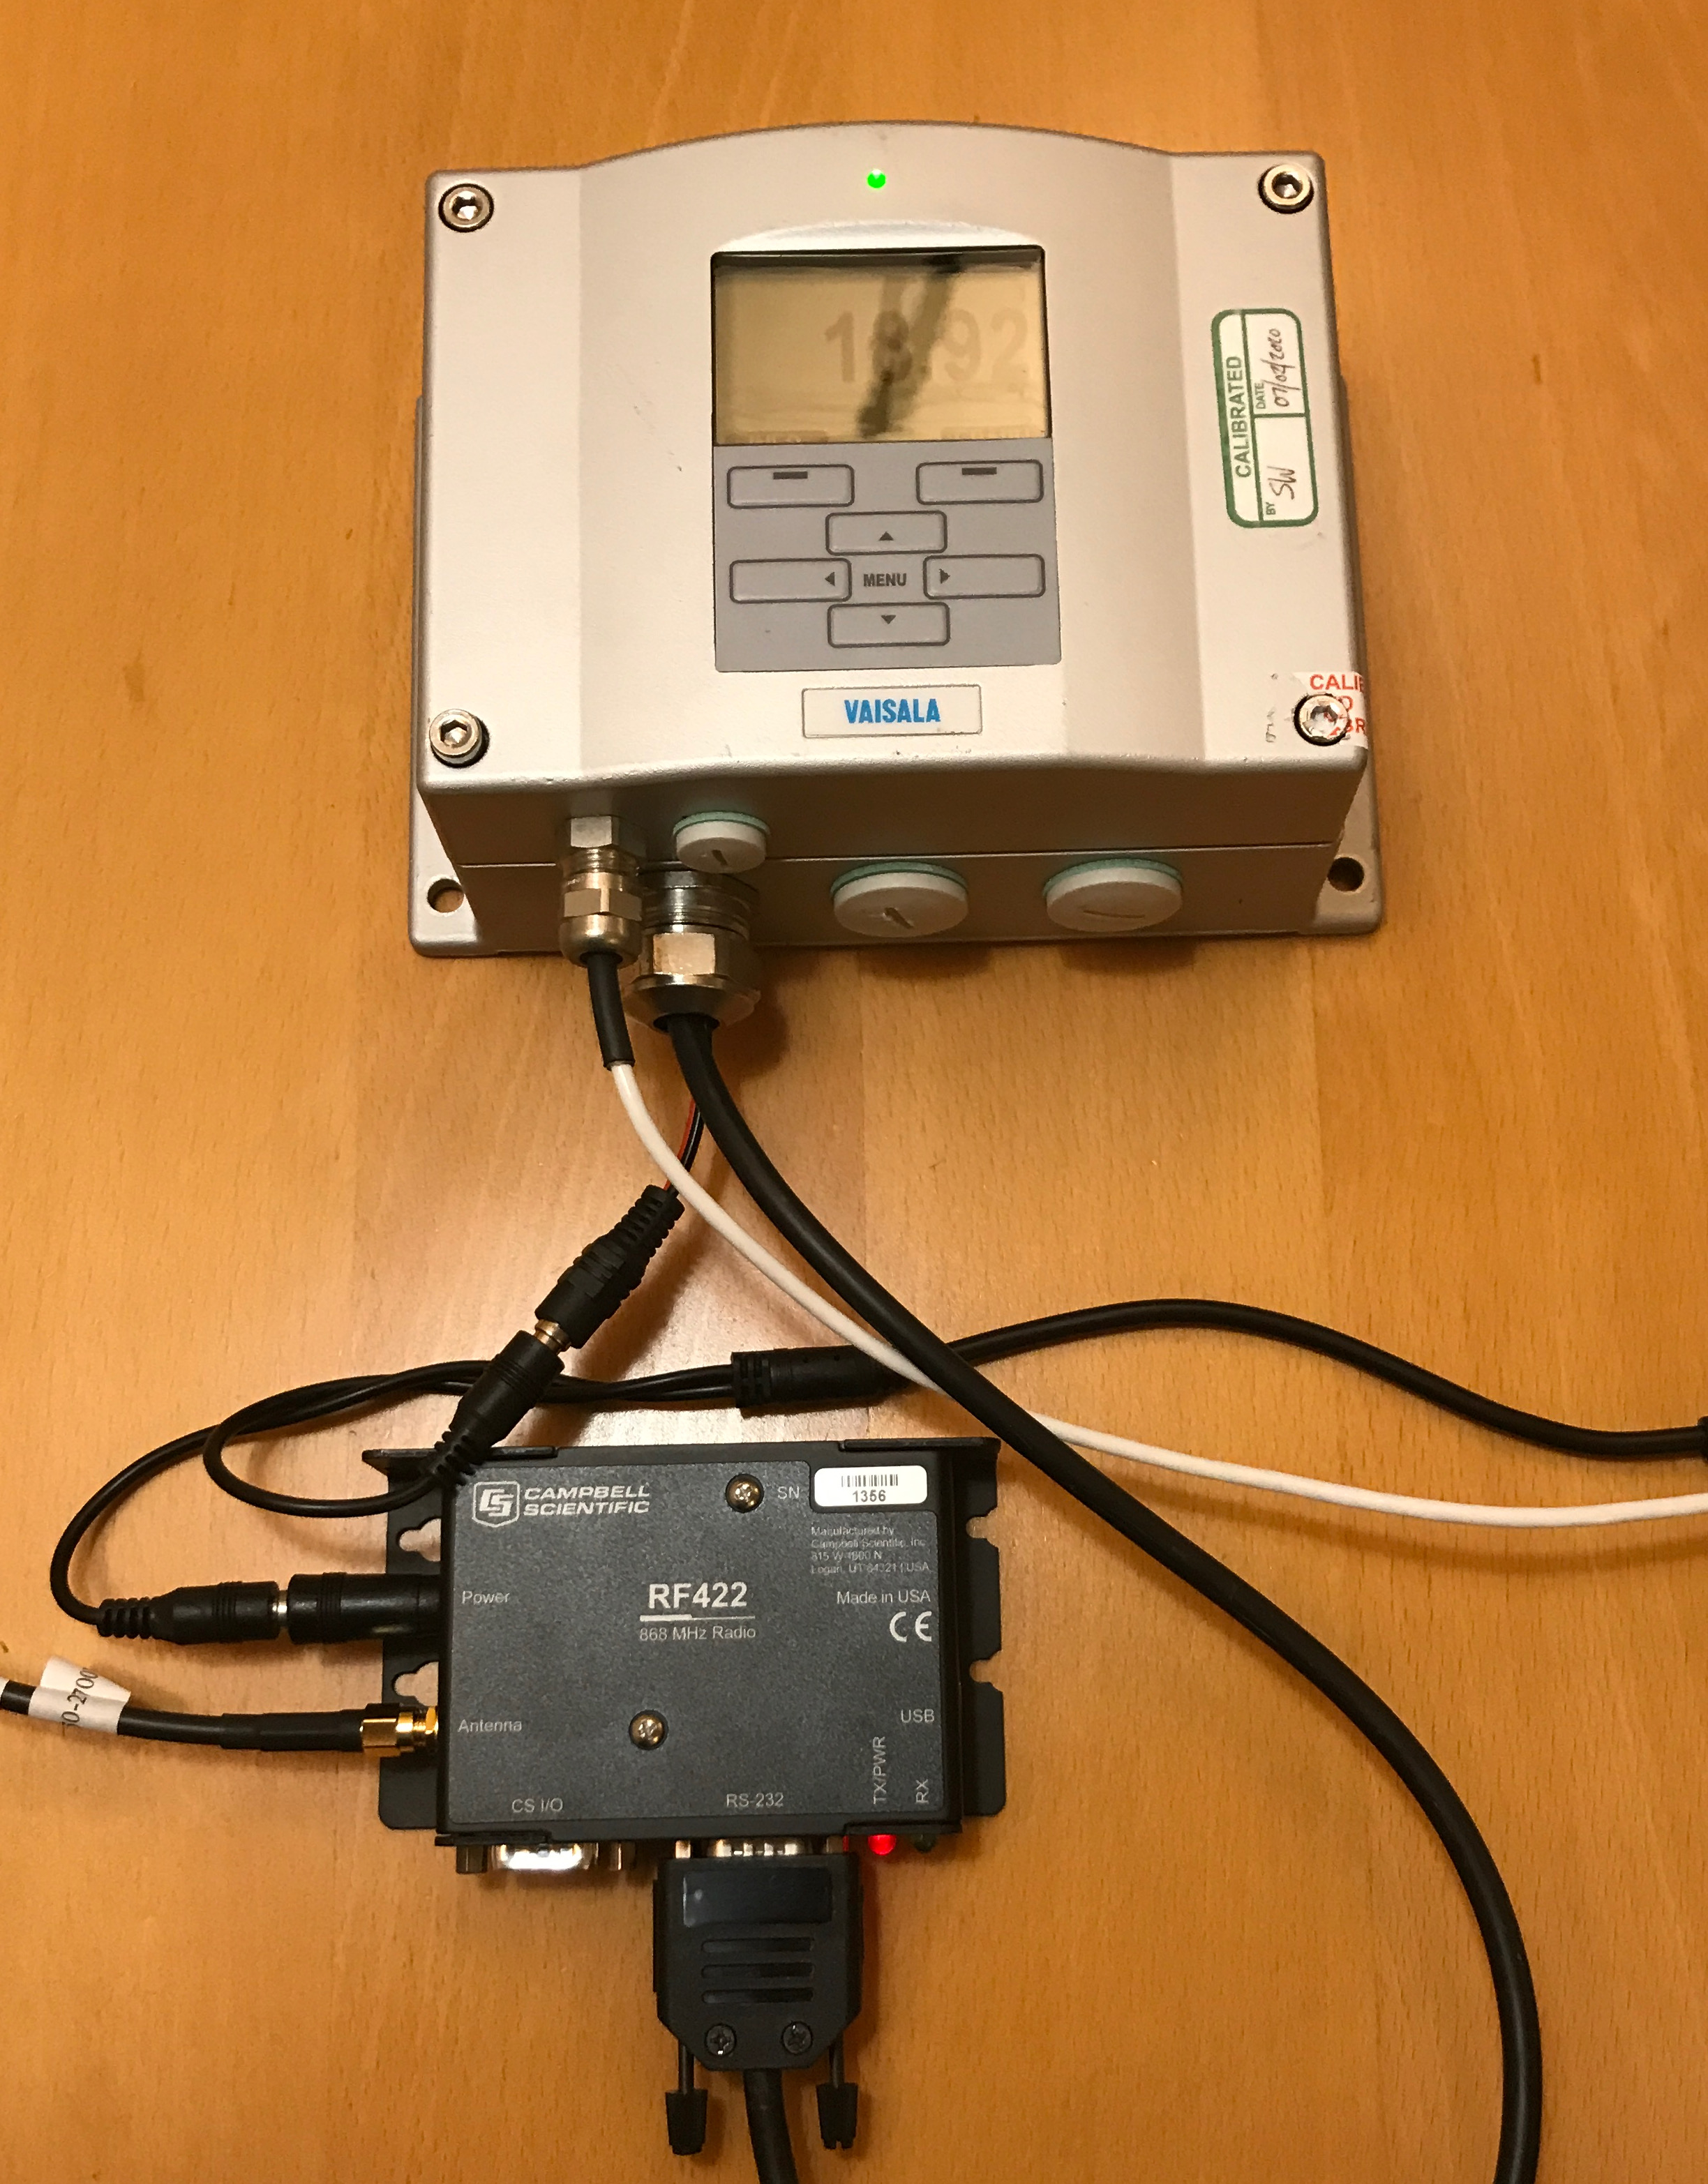
OK, so we have a number of high quality Vaisala HMT333 temperature sensors at various geographical locations (solar/battery powered). At the moment a volunteer observer goes to the site, takes manual readings from the instrument, goes back and then submits these readings to the Met Office Weather Observations Website (WoW).
It would be nice to collect this data automatically and more frequently but also provide a nice little display for the observer in their own home. The prototype I built uses a Raspberry Pi4 and the official LCD touchscreen - really nice LCD case from https://smarticase.com. To get the data from the sensor to the PI I’m using two Campbell Scientific RF422 spread spectrum radio units that easily have a range of 1-2 KM and only use tiny amounts of power.
The display unit connects to the observers home WiFi and transmits data to WoW every 10 minutes. I had to incorporate a way for the local observer to enter their WoW account details and calibration coefficients for the particular sensor in use. They also get a warning when the sensor is due for recalibration and a warning is also produced if no data has been received after a certain time period.
I based the unit on the Balena Dash project but incorporated a Python Flask web application container to deliver the main display and settings pages. Separate containers are used for dealing with the sensor data collection and WoW transmissions, communications between the containers is via http.
Of course you could just use a data unit next to the sensor without a display, but then we would be out of range of WiFi, have to consider power consumption and wouldn’t be able to give the observer a nice little display. You could give them access to a web page/dashboard, but a lot of people don’t want to have to use their phone or computer, they like just being able to glance up at a stand alone display. I suppose that’s why most home weather stations come with a standalone display unit.
Anyway it all seems to be working very well and didn’t take so long to develop thanks to Balena’s technologies. Next stage is to put a few prototypes out in the field for an extended test period and to get some feedback from the observers. Things can move quite slowly in large organisations but it’s looking promising at the moment. Here’s some photos (the WoW account info are just placeholder examples!)
@markysparks great stuff! I’m so happy to see you not only using balena blocks but also balenaDash! What a nice solution
I wanted to also point you at balena-electron-env if you haven’t seen it already. Granted it’s for electron apps but adds some nice touches such as on-screen keyboard and WiFi configuration interface. Might be of use for a future version?
That’s great @markysparks ! It looks like such a well thought-out solution.
Chris’s electron block suggestion is a good one. If you do decide to stick with the browser block though, we also have a version 2 which will be released soon. It wraps Chromium in a Node.JS API, so other containers (or an external service, if you route the device public URL to the API port) can control it. I mention it in case you ever have a need refresh the browser, or show any other page.
You’re welcome to try the beta by using this image: phildwilson/browser API doc
There is also a remote control for it here, which you can deploy alongside: phildwilson/browsercontrol
And let me know if you need any more help with your awesome project!
Phil - Just thought I’d let you know that I tried out the new browser block, all working very well though I haven’t had to use the API just yet. Also couldn’t resist using the dashboard and connector blocks (connector block makes things so much easier - great work!).
So now I have a nice Grafana graph Think I like this better than my basic dashboard! I’ll see what feedback I get.
I have got some network ports exposed that I didn’t before, but then that allows the local user to also see the dashboard on their PC (assuming its connected to the same network) which is quite nice.
That’s great that you’re finding the other blocks useful! Especially connector since (selfishly) I spent quite a long time getting it to function. I’ve got a number of extra features to add to it, but I was waiting to see whether the community used and liked it, before putting more effort that way.
We’ve got some other blocks about to be added to hub.balena.io - so keep your eyes peeled. One of which is a generic sensor block, which you may be interested in.
Keep the updates coming - I’m sharing them with the team. It’s uplifting to hear stories of where we’ve succeeded in reducing our user’s IOT friction.


 Think I like this better than my basic dashboard! I’ll see what feedback I get.
